
How Many Attempts Do UPSC Aspirants Take Before Selection? What the Official Statistics Show
Rajshree Mourya
A mentor for UPSC.

Understand UPSC attempt-wise selection statistics, the difference between a typical attempt and a success rate, and how to plan your next step sensibly.
By Rajshree Mourya
Does selection usually happen in the first attempt, or after several tries? A topper's story gives one person's experience. A distribution tells us how a whole group is spread. The distinction matters when you are deciding how to prepare, whether to attempt again, or how much time to commit.
Short answer: in the official CSE 2022 recommendation profile examined here, the third and fourth attempts were the largest groups. This is a historical snapshot, not a promised timetable for any aspirant.
The official attempt-wise figures
UPSC's 74th Annual Report (2023–24), Appendix 9, Table 8-C, printed page 106, profiles 1,020 recommended CSE 2022 candidates. Its distribution is:
1st attempt: 63 candidates (6.2%).
2nd attempt: 129 candidates (12.6%).
3rd attempt: 223 candidates (21.9%).
4th attempt: 224 candidates (22.0%).
5th attempt: 180 candidates (17.6%).
6th attempt: 107 candidates (10.5%).
7th attempt: 36 candidates (3.5%).
8 or more attempt: 58 candidates (5.7%).
Open or save the attempt-wise revision chart.
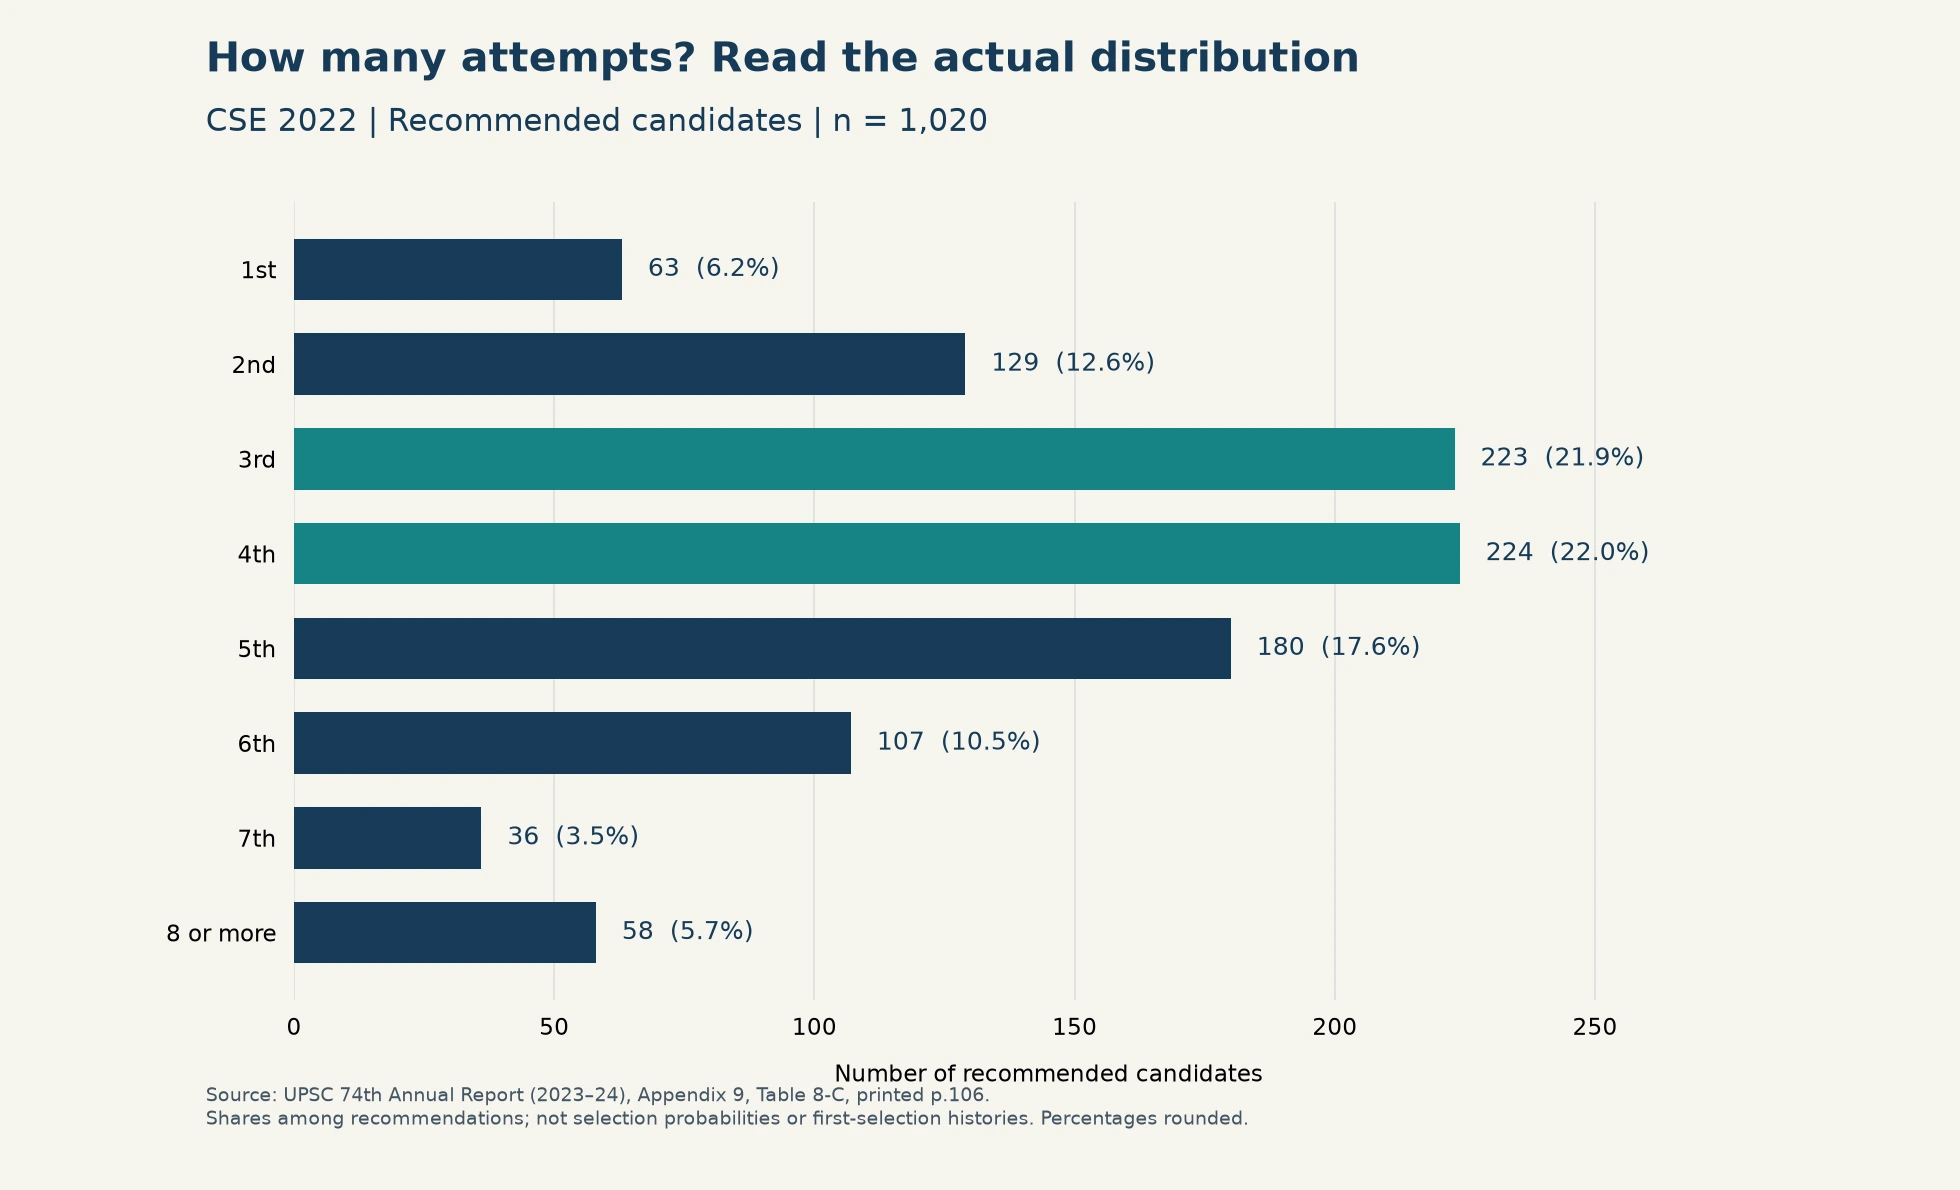
Calculated from these counts: the third and fourth attempts together account for 43.8%; the median is the fourth attempt. Fourth is the mode, ahead of third by just one candidate. These are shares of recommendations, not attempt-wise chances of selection.
What “usual” means—and what it does not
A mode is the largest single group; a median splits ordered observations in half. Neither is a deadline. The open-ended “8 or more” group prevents an exact arithmetic mean from being recovered from this table. It profiles recommendations in one examination cycle, not each candidate's first-ever selection. It is also not IAS-only data or a 2026 result.
The report's recommendation total includes its reserve-list accounting. Keep its denominator when using its attempt distribution; do not combine it with an initial result-release total.
Why a selected-candidate share is not your probability
Imagine an entirely illustrative classroom in which 20 prize winners include 8 students who took the test a second time. “Eight out of twenty winners were second-time participants” does not tell us how many second-time participants there were altogether. If 10 took part, the relevant rate is different from a situation in which 100 took part.
The same denominator question belongs in every examination chart. To estimate a particular attempt group's selection rate, you need a compatible count of all candidates appearing in that group, not only a list of winners. Even then, it would be an observed group rate, not a personalised forecast.
There is another limit: a selected-candidate table leaves out people who never get selected. Using only success stories to estimate how long all aspirants should persist is a form of survivorship bias. A preparation plan should account for uncertainty, personal circumstances and other career options.
An attempt is not the same as a year of preparation
Under the CSE 2026 notice, pages 14–15, actually appearing in either Preliminary paper counts as an attempt; merely submitting an application is not the same as appearing. Check your own year's rules, eligibility and applicable attempt restrictions.
Someone may study before their first appearance, skip an examination year, or prepare while working. Therefore, converting an attempt number directly into an equal number of full-time preparation years is unreliable. Count your examination appearances and your preparation timeline separately.
How to use the figures without losing confidence
If you are preparing for your first attempt, the existence of repeat candidates is a reason to build a serious foundation—not a reason to treat the first attempt casually. If you have already appeared, a setback does not prove you lack ability. It does mean the next plan should change something you can identify and test.
Here is a suggested review process. It is a planning tool, not a formula for selection:
Locate the bottleneck. Was it content coverage, CSAT, question interpretation, recall, answer completion or something else? Separate an evidence-based diagnosis from a general feeling that “everything was wrong”.
Choose one measurable change. For example, replace passive rereading of a weak topic with closed-book explanation and a review of errors. Record what improves and what still fails.
Seek specific feedback. A reviewer should identify inaccurate facts, missing reasoning and unfinished answers. Encouragement alone cannot tell you what to repair.
Review the practical cost. Consider time, wellbeing, family responsibilities and career continuity. Set a review date and keep a realistic alternative route active.
Use PrepCat's Syllabus Tracker to select a manageable backlog and revisit it after practice. A completed reading task and the ability to answer a question from memory are different milestones. Track both.
Three claims to avoid
“The fourth attempt guarantees success.” A peak in a historical distribution cannot promise an outcome.
“Everyone needs several attempts.” A group pattern cannot establish what any particular candidate needs.
“One more attempt will fix the problem.” Repetition needs a diagnosis, a workable change and an honest review of progress.
Conclusion
The useful lesson is to make each attempt informed and purposeful. Treat published statistics as context, then decide from your preparation evidence and circumstances. Neither continuing nor changing direction determines your worth. A sound decision protects your learning, your wellbeing and your future options.
Published 26 October 2026. Statistics refer to CSE 2022 in the cited annual report; they are not presented as current-year results. Chart percentages are calculated from the report's counts and rounded to one decimal place.