
Environment06/10/2026
The Greenhouse Effect: A Visual Explainer
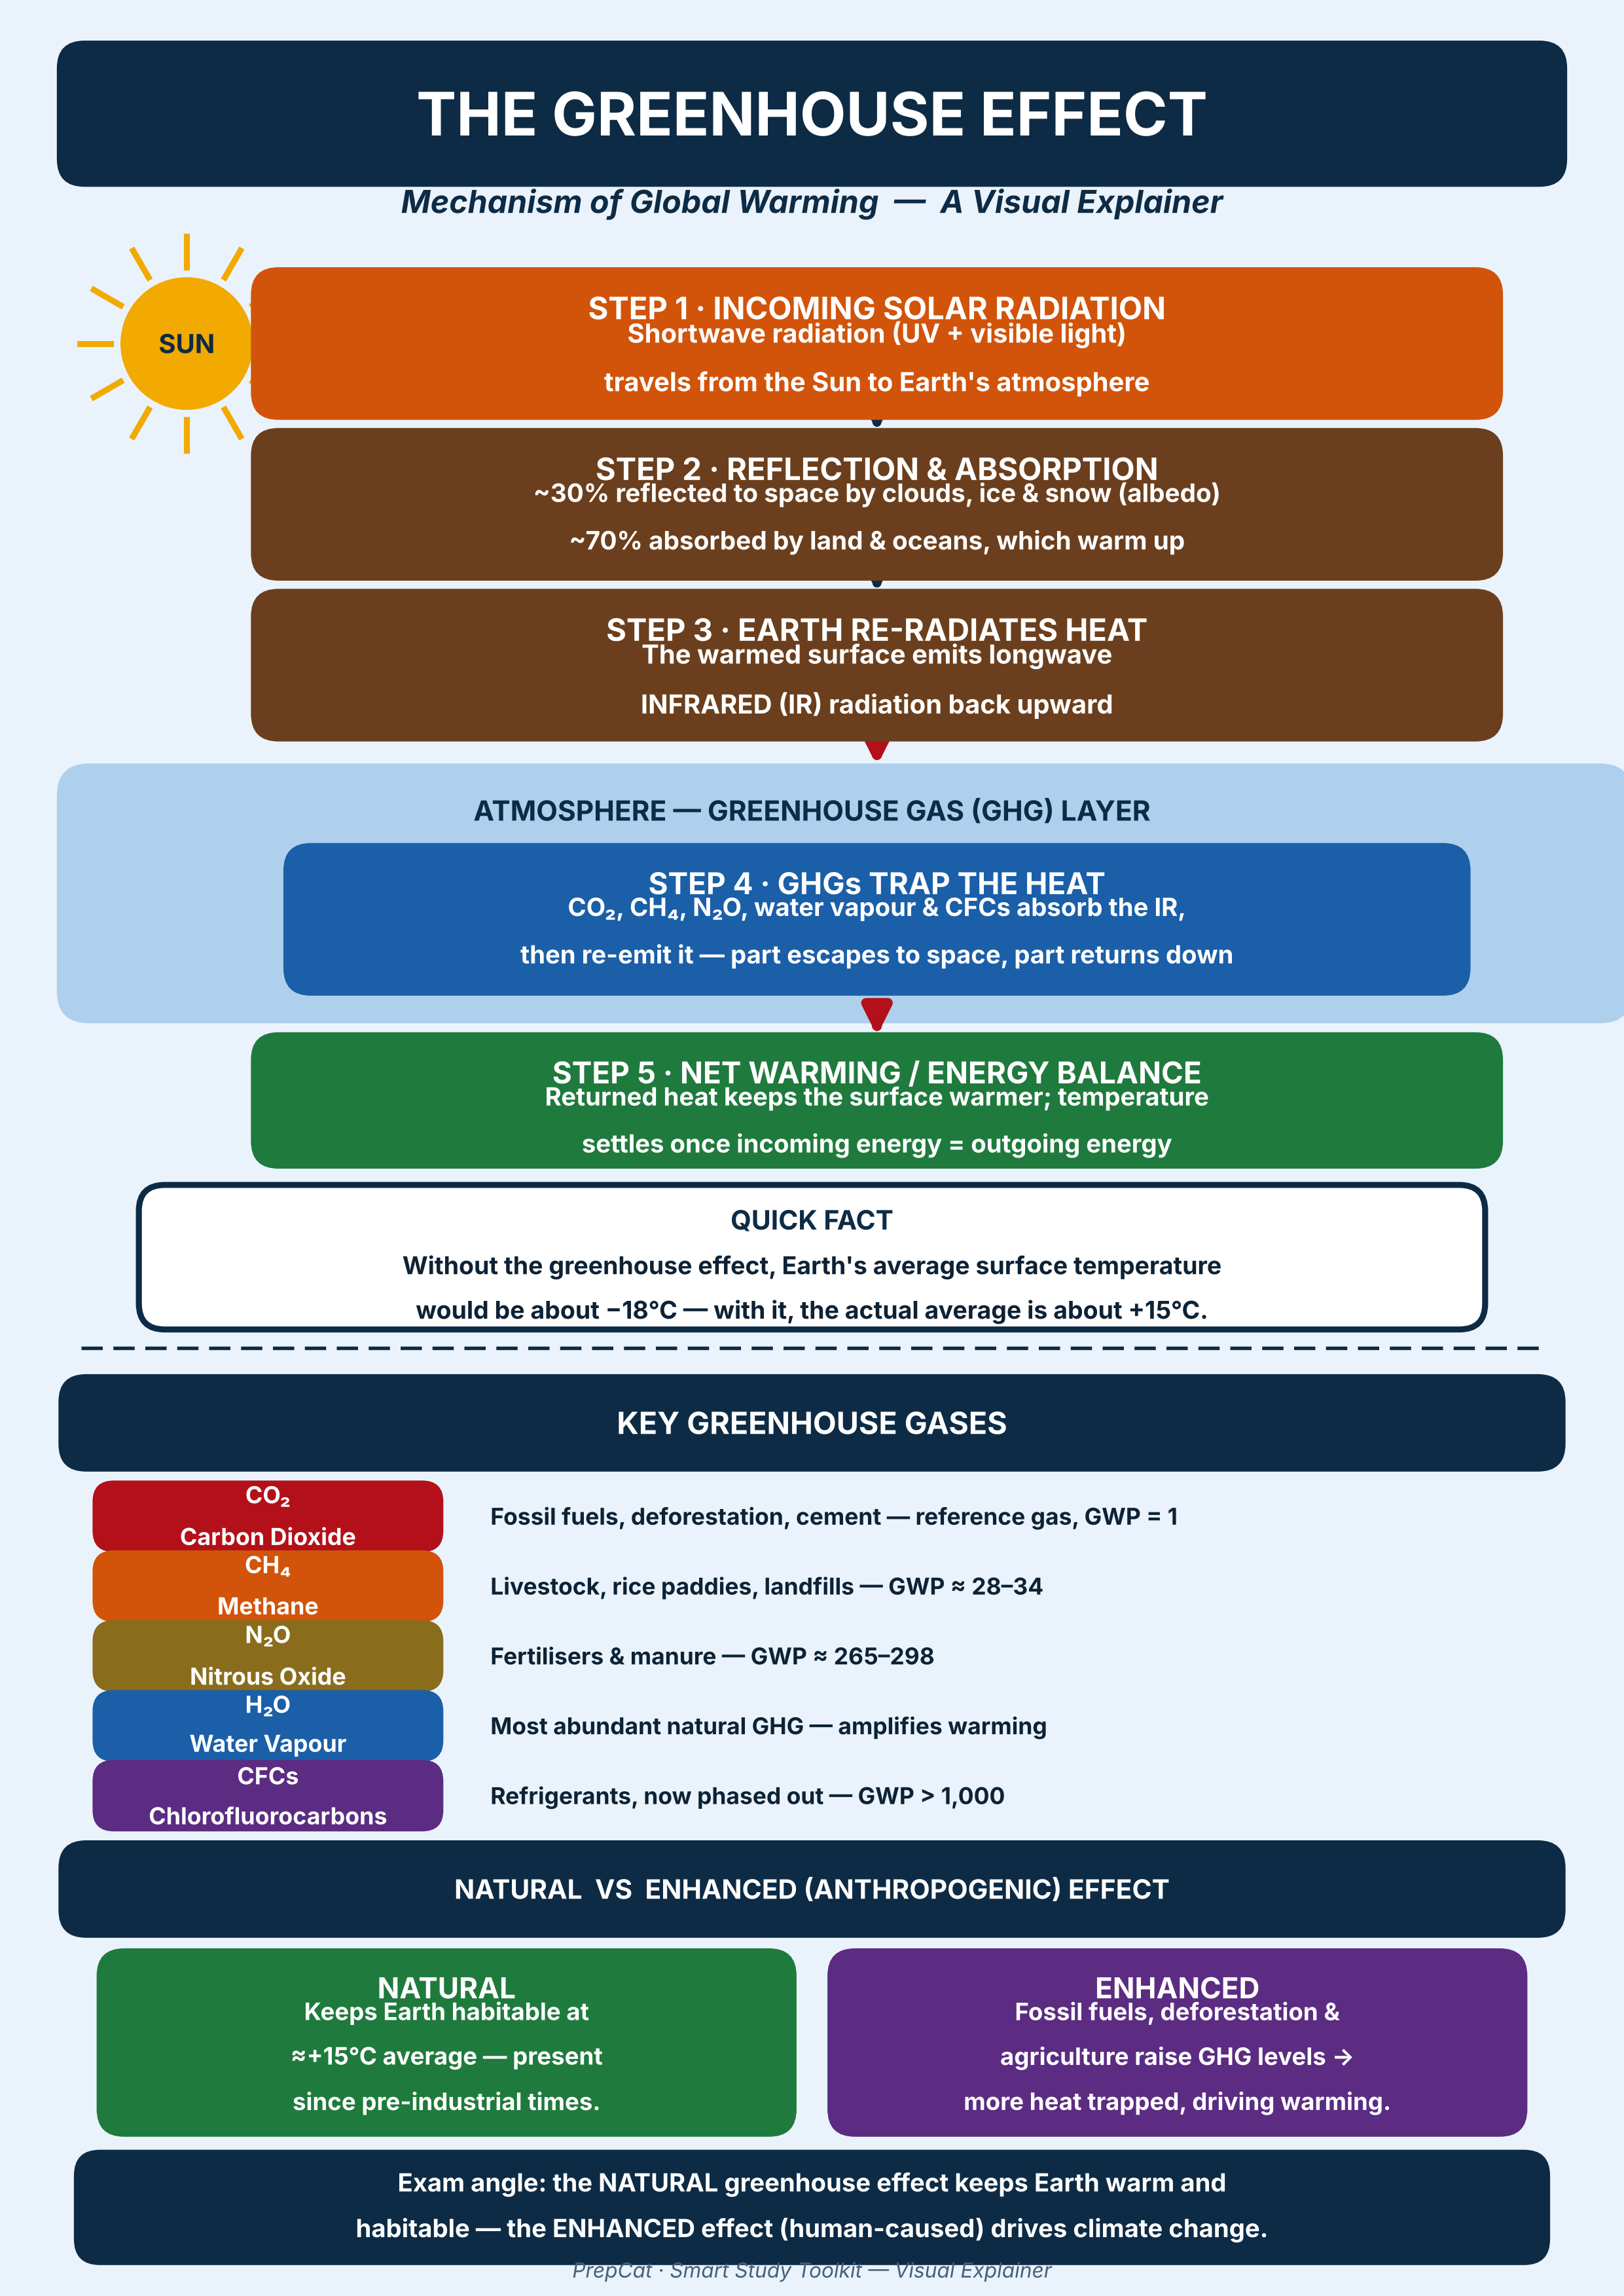
A single infographic tracing how incoming solar radiation becomes trapped heat — from absorption at Earth's surface to greenhouse gas re-emission and net warming.
Smart Study Toolkit
📌 Revision Pointers
Solar radiation in → surface absorption → IR re-radiation → GHG trapping → net warming
Key gases: CO₂ (GWP = 1), CH₄ (≈28–34), N₂O (≈265–298), water vapour, CFCs (>1,000)
Natural effect keeps Earth at ≈+15°C; the enhanced (human-caused) effect drives global warming
Visual flowchart of the five-step greenhouse mechanism, key greenhouse gases by warming potential, and the natural-vs-enhanced effect distinction.
💭 Conclusion
A frequently tested Prelims diagram-based concept — expect questions distinguishing the natural from the enhanced greenhouse effect and ranking GHGs by warming potential.